Environment
Performance Data (Environmental)
Scope of reporting and data coverage rate
Aisin Corporation
49.7%
51 domestic Group companies
64.1%
Consolidated
100%
Calculation method for coverage rate

Historical data may have been restated due to changes in the scope of aggregation or items being aggregated.
Starting with FY2022 results, parent figures for Aisin Corporation increased due to the integration of the former Aisin Seiki and the former Aisin AW.
| Aisin Corporation | Aisin Corporation (parent) |
|---|---|
| 51 domestic Group companies | Aisin, Aisin Takaoka, Aisin Chemical, Aisin Keikinzoku, Aisin Kiko, Aisin Sin’ei, Aisin Fukui, Hosei Brake Industry, ADVICS, Aisin Shiroki, ART Metal Mfg., Aisin Development, Aisin Tohoku, Aisin Kyushu, Aisin Kyushu Casting, Aisin Hokkaido, Aichigiken, Saitama Kogyo, Kotobuki Industry, Yamagata Clutch, Sinsan, Konan Kogyo, Hekinan Unso, Sanetsu Unyu, Technova, Aisin Collabo, Aisin Software, FT Techno, IMRA Japan, CVTEC, CVTEC Hokkaido, CVTEC Kyushu, Aisin Mizunami, Aisin Metaltech, Aisin Digital Engineering, Aisin Logitech Service, Aisin Machinetech, Awqius Japan, Aisin Sinwa, Shinwa Kogyo, AT Kyusyu, Aisin Takaoka Tohoku, Hirabayashi Industry, Aisin Takaoka Engineering, Shinko Seiki, TECHNO-METAL, Tonamino Kogyo, AS Brake Systems, Kyushu Shiroki, Matsumi Corporation, Suncircle (51 companies) |
Resource input and emissions (FY2025)

Pollutant Release and Transfer Register (PRTR): a system where businesses track and report to the government the amounts of various hazardous chemicals released into the environment (air, water, soil) from their facilities, as well as the amounts transferred offsite as waste. The government then estimates and publishes the total release and transfer amounts based on these reports.
sulfur hexafluoride (SF6): a greenhouse gas with a global warming potential estimated to be 22,800 times that of CO2.
Greenhouse gases (consolidated)
Greenhouse gas emissions
Calculation method
Total CO2 emissions = Σ (fuel consumption × CO2 emission factor) + Σ (purchased electricity × CO2 emission factor)
CO2 emission factor
[Emissions for FY2020–FY2025]
Japan
Fuel
Emission factors based on IPCC 2006, 2006 IPCC Guidelines for National Greenhouse Gas Inventories
Purchased electricity
Adjusted emission factors by electric utility provider published by the ministry of the environment and the ministry of economy, trade and industry
(2019, 2020: FY2019, 2021: FY2021, 2022: FY2022, 2023: FY2023, 2024: FY2024)
Overseas
Fuel
Emission factors based on IPCC 2006, 2006 IPCC guidelines for national greenhouse gas inventories
Purchased electricity
Emission factors based on IEA: CO2 emissions from fuel combustion
(2019, 2020: IEA 2017, 2019 edition, 2021: IEA 2019, 2021 edition, 2022: IEA 2020, 2022 edition, 2023: IEA 2021, 2023 edition, 2024: IEA 2022, 2024 edition)
SF6 CO2 conversion uses the global warming potential (GWP) values specified in the “enforcement order for the act on the promotion of measures to cope with global warming.”
Total scope 1, 2, and 3
(t-CO2e)
| FY2020 | FY2021 | FY2022 | FY2023 | FY2024 | FY2025 |
|---|---|---|---|---|---|
| 26,016,371 | 24,515,960 | 25,530,744 | 24,088,622 | 25,224,731 | 23,596,868 |
CO2 emissions from manufacturing
(t-CO2e)
| Item | FY2020 | FY2021 | FY2022 | FY2023 | FY2024 | FY2025 |
|---|---|---|---|---|---|---|
| Scope1 | 630,904 | 577,100 | 602,011 | 533,137 | 525,133 | 491,009 |
| Scope2 | 2,080,878 | 1,907,664 | 1,963,240 | 1,745,595 | 1,755,040 | 1,657,897 |
| Total | 2,711,782 | 2,484,764 | 2,565,251 | 2,278,732 | 2,280,173 | 2,148,906 |
Supply chain emissions (Scope 3)
(t-CO2e)
| Item | FY2020 | FY2021 | FY2022 | FY2023 | FY2024 | FY2025 |
|---|---|---|---|---|---|---|
| 1.Purchased products and services | 10,905,462 | 10,666,463 | 11,373,619 | 10,736,420 | 11,177,441 | 11,022,068 |
| 2.Capital goods | 999,649 | 654,409 | 752,442 | 761,807 | 791,314 | 769,659 |
| 3.Fuel and energy-related activities not included in Scope 1 and 2 | 438,413 | 398,144 | 409,028 | 361,030 | 348,710 | 328,008 |
| 4.Transportation and distribution (upstream) | 578,235 | 525,970 | 608,026 | 669,230 | 689,386 | 554,313 |
| 5.Waste generated from operations | 73,710 | 70,085 | 54,752 | 53,040 | 58,472 | 55,266 |
| 6.Business travel | 19,218 | 9,348 | 11,552 | 13,814 | 16,149 | 17,735 |
| 7.Employee commutation | 60,852 | 40,701 | 37,080 | 32,963 | 36,868 | 51,288 |
| 8.Leased assets (upstream) | ― | ― | ― | ― | ― | ― |
| 9.Transportation and distribution (downstream) | 160,454 | 155,584 | 158,884 | 168,284 | 175,895 | 192,164 |
| 10.Processing of sold products | 488,317 | 505,268 | 492,297 | 517,713 | 379,242 | 311,603 |
| 11.Use of products sold | 9,309,776 | 8,742,538 | 8,814,825 | 8,230,378 | 9,042,565 | 7,967,008 |
| 12.End-of-life handling of products sold | 29,414 | 28,068 | 29,558 | 29,261 | 29,789 | 21,936 |
| 13.Leased assets (downstream) | ― | ― | ― | ― | ― | ― |
| 14.Franchising | ― | ― | ― | ― | ― | ― |
| 15.Investments | 173,679 | 167,025 | 150,733 | 167,752 | 127,995 | 95,071 |
| Total | 23,237,179 | 21,963,602 | 22,892,795 | 21,741,694 | 22,873,825 | 21,386,118 |
Greenhouse gas reduction targets certified by SBTi
| Scope | 2030 target (vs. FY2019) |
|---|---|
| Scope 1 & 2 | 46.2% reduction |
| Scope 3 (categories 1 & 11) | 27.5% reduction |
Progress toward targets
In November 2023, Aisin received certification from the science-based targets initiative (SBTi) confirming that its Scope 1 and 2 reduction targets align with the 1.5°C pathway. Alongside this certification, the company also received approval confirming that its reduction targets for Scope 3 emissions intensity in categories 1 and 11 align with the Well Below 2°C pathway.
Reduction rate (%) compared to base fiscal year (FY2020)
| Item | FY2021 | FY2022 | FY2023 | FY2024 | FY2025 |
|---|---|---|---|---|---|
| Scope 1 & 2 | 8.2 | 5.1 | 15.6 | 15.4 | 20.5 |
| Scope 3 (categories 1 & 11) | 4.0 | 0.1 | 6.2 | 0.0 | 6.1 |
Environmental management
Number of companies with ISO 14001 certification and certification rate
(companies)
| Aisin Corporation | |
|---|---|
| Item | FY2025 |
| Number of production companies* | 128 |
| Number of acquired companies* | 115 |
| Percentage of companies acquired (%) | 90 |
Excludes companies operating for less than three years since production start
Number of environmental incidents and agreement value exceedances
(incidents)
| Aisin Corporation | |||||
|---|---|---|---|---|---|
| Item | FY2021 | FY2022 | FY2023 | FY2024 | FY2025 |
| Regulatory violations, exceeding agreed values | 1*1 | 0 | 0 | 0 | 0 |
| Environmental incidents | 0 | 1*2 | 0 | 0 | 1*14 |
| Domestic and overseas Group companies | |||||
|---|---|---|---|---|---|
| Item | FY2021 | FY2022 | FY2023 | FY2024 | FY2025 |
| Regulatory violations, exceeding agreed values | 2*1,*3 | 2*4,*5 | 1*7 | 3*8,*9,*10 | 1*15 |
| Environmental incidents | 0 | 2*2,*6 | 0 | 3*11,*12,*13 | 2*16,*17 |
Aisin Corporation (exceeded dioxin standards)
Aisin Corporation (ATF spill)
Aisin Mizunami (exceeded BOD standards)
Shiroki industries (exceeded agreed value for zinc)
Anqing Art Tp Piston (exceeded COD standards)
Konan Industries (light oil spill)
Aichigiken (exceeded BOD standard)
Guangzhou Shiroki Corp. (exceeded phosphorus standard)
Aisin Kyushu Casting (exceeded NOx standard)
Aisin Shiroki (exceeded standard for normal-hexane extracts)
Aisin Shiroki (heavy oil spill)
Aisin Autoparts Thailand (oil-containing wastewater spill)
Aisin Metaltech (bonding wastewater spill)
Aisin Corporation (domestic wastewater overflow causing offsite discharge)
Aisin Fukui (domestic wastewater BOD exceeding agreed value)
Aisin Chemical (offsite discharge of rainwater with pH exceeding standard)
ADVICS Manufacturing Mexico (offsite discharge of acidic waste liquid)
Environmental audit (conducted by departments charged with environmental management)
| Aisin Corporation | |||||
|---|---|---|---|---|---|
| Item | FY2021 | FY2022 | FY2023 | FY2024 | FY2025 |
| Number of sites audited | 20 | 37 | 37 | 37 | 38 |
| Number of items identified as needing improvement | 5 | 2 | 0 | 3 | 0 |
| Number of internal auditors | 478 | 1,385 | 1,132 | 1,412 | 1,508 |
| Number of auditor training sessions | 4 | 4 | 11 | 10 | 11 |
| Domestic Group companies: 51 (FY2021: 52 companies, FY2022: 50 companies, FY2023: 56 companies, FY2024: 52 companies) |
|||||
|---|---|---|---|---|---|
| Item | FY2021 | FY2022 | FY2023 | FY2024 | FY2025 |
| Number of sites audited | 140 | 158 | 146 | 169 | 139 |
| Number of items identified as needing improvement | 390 | 418 | 313 | 369 | 269 |
| Number of internal auditors | 3,018 | 3,265 | 3,034 | 3,510 | 3,799 |
| Number of auditor training sessions | 29 | 28 | 34 | 42 | 52 |
Number of environmental training participants
(people)
| Aisin Corporation | |||||
|---|---|---|---|---|---|
| Item | FY2021 | FY2022 | FY2023 | FY2024 | FY2025 |
| Training for departments charged with environmental management | 1,640 | 3,029 | 8,861 | 3,295 | 6,364 |
| General training for all departments | 14,140 | 27,590 | 26,924 | 25,891 | 32,764 |
| 51 domestic Group companies (52 companies in FY2021, 50 companies in FY2022, 56 companies in FY2023, 52 companies in FY2024) |
|||||
|---|---|---|---|---|---|
| Item | FY2021 | FY2022 | FY2023 | FY2024 | FY2025 |
| Training for departments charged with environmental management | 2,024 | 3,518 | 9,379 | 3,718 | 6,708 |
| General training for all departments | 18,968 | 30,976 | 33,263 | 32,441 | 40,752 |
Energy
Calorific value conversion for each energy source uses coefficients specified in the Enforcement Regulations of the Law Concerning the Rational Use of Energy.
Total direct energy consumption
(GJ)
| Aisin Corporation | ||||||
|---|---|---|---|---|---|---|
| Item | FY2021 | FY2022 | FY2023 | FY2024 | FY2025 | |
| Total direct energy consumption | 1,290,631 | 2,864,497 | 2,227,960 | 1,785,945 | 1,603,095 | |
| Breakdown by type | Coal products (anthracite, coke, etc.) |
0 | 0 | 0 | 0 | 0 |
| Natural gas | 1,255,106 | 2,581,144 | 1,959,485 | 1,510,318 | 1,357,251 | |
| Petroleum products (gasoline, diesel oil, LNG, etc.) |
35,525 | 283,353 | 268,475 | 275,627 | 245,844 | |
| Consolidated (manufacturing) | ||||||
|---|---|---|---|---|---|---|
| Item | FY2021 | FY2022 | FY2023 | FY2024 | FY2025 | |
| Total direct energy consumption | 10,078,315 | 11,106,260 | 9,703,351 | 9,328,561 | 8,601,860 | |
| Breakdown by type | Coal products (anthracite, coke, etc.) |
1,296,850 | 1,387,412 | 1,166,380 | 1,307,785 | 1,188,576 |
| Natural gas | 7,347,497 | 8,230,803 | 7,154,206 | 6,694,162 | 6,133,735 | |
| Petroleum products (gasoline, diesel oil, LNG, etc.) |
1,433,969 | 1,488,045 | 1,382,765 | 1,326,614 | 1,279,549 | |
Indirect energy consumption
(GJ)
| Aisin Corporation | ||||||
|---|---|---|---|---|---|---|
| Item | FY2021 | FY2022 | FY2023 | FY2024 | FY2025 | |
| Total indirect energy consumption | 2,881,804 | 9,274,112 | 8,822,730 | 9,274,464 | 8,513,732 | |
| Breakdown by type | Purchased electricity | 2,870,299 | 9,250,979 | 8,078,720 | 7,888,115 | 7,378,367 |
| Purchased electricity ratio (%) | 99.6 | 99.8 | 91.6 | 85.1 | 86.7 | |
| Solar and wind power generation | 11,505 | 23,133 | 744,010 | 1,386,349 | 1,135,364 | |
| Renewable energy ratio (%) | 0.4 | 0.2 | 8.4 | 14.9 | 13.3 | |
| Consolidated (manufacturing) | ||||||
|---|---|---|---|---|---|---|
| Item | FY2021 | FY2022 | FY2023 | FY2024 | FY2025 | |
| Total indirect energy consumption | 39,551,740 | 44,185,247 | 43,245,844 | 43,103,590 | 41,055,174 | |
| Breakdown by type | Purchased electricity | 39,541,385 | 43,739,819 | 41,249,237 | 39,764,810 | 37,649,623 |
| Purchased electricity ratio (%) | 100.0 | 99.0 | 95.4 | 92.3 | 91.7 | |
| Solar and wind power generation | 10,355 | 445,428 | 1,996,607 | 3,338,780 | 3,405,552 | |
| Renewable energy ratio (%) | 0.0 | 1.0 | 4.6 | 7.7 | 8.3 | |
Chemical substances
(t)
| Aisin Corporation | |||||
|---|---|---|---|---|---|
| Item | FY2021 | FY2022 | FY2023 | FY2024 | FY2025 |
| PRTR emissions | 227 | 391 | 239 | 204 | 206 |
| 51 domestic Group companies (52 companies in FY2021, 50 companies in FY2022, 56 companies in FY2023, 52 companies in FY2024) |
|||||
|---|---|---|---|---|---|
| Item | FY2021 | FY2022 | FY2023 | FY2024 | FY2025 |
| PRTR emissions | 405 | 537 | 343 | 358 | 417 |
Raw materials input
(t)
| Aisin Corporation | ||||||
|---|---|---|---|---|---|---|
| Item | FY2021 | FY2022 | FY2023 | FY2024 | FY2025 | |
| Total raw materials input | 774,565 | 798,729 | 741,301 | 924,037 | 858,981 | |
| Breakdown by type | Metals, resins, etc. (purchased materials) |
774,338 | 798,338 | 741,075 | 923,686 | 858,655 |
| Chemical substances (PRTR reportable substance handling volume) |
227 | 391 | 226 | 351 | 326 | |
| 51 domestic Group companies (52 companies in FY2021, 50 companies in FY2022, 56 companies in FY2023, 52 companies in FY2024) |
||||||
|---|---|---|---|---|---|---|
| Item | FY2021 | FY2022 | FY2023 | FY2024 | FY2025 | |
| Total raw materials input | 1,538,268 | 1,504,520 | 1,424,355 | 1,605,489 | 1,527,092 | |
| Breakdown by type | Metals, resins, etc. (purchased materials) |
1,536,897 | 1,503,174 | 1,423,623 | 1,601,733 | 1,523,521 |
| Chemical substances (PRTR reportable substance handling volume) |
1,372 | 1,346 | 733 | 3,756 | 3,571 | |
Waste & recycling
(t)
| Aisin Corporation | |||||||
|---|---|---|---|---|---|---|---|
| Item | FY2020 | FY2021 | FY2022 | FY2023 | FY2024 | FY2025 | |
| Waste and recyclable materials | Total waste discharge | 51,231 | 47,881 | 128,004 | 127,454 | 121,935 | 112,270 |
| Recycled resources (recycling) volume |
50,977 | 47,555 | 127,584 | 126,912 | 119,412 | 110,213 | |
| Recycling rate (%) | 99.5 | 99.3 | 99.7 | 99.6 | 97.9 | 98.2 | |
| Final waste treatment volume | 0.0 | 0.0 | 15.3 | 0.2 | 0.4 | 0.5 | |
| Industrial waste | Total waste discharge | 3,381 | 2,910 | 9,940 | 9,303 | 9,191 | 8,273 |
| Recycled resources (recycling) volume |
3,127 | 2,584 | 9,521 | 8,762 | 6,668 | 6,216 | |
| Recycling rate (%) | 92.5 | 88.8 | 95.8 | 94.2 | 72.5 | 75.1 | |
| Final waste treatment volume | 0.0 | 0.0 | 15.3 | 0.2 | 0.4 | 0.5 | |
| 51 domestic Group companies (52 companies in FY2021, 50 companies in FY2022, 56 companies in FY2023, 52 companies in FY2024) |
|||||||
|---|---|---|---|---|---|---|---|
| Item | FY2020 | FY2021 | FY2022 | FY2023 | FY2024 | FY2025 | |
| Waste and recyclable materials | Total waste discharge | 388,537 | 309,854 | 444,466 | 417,436 | 483,885 | 423,209 |
| Recycled resources (recycling) volume |
382,370 | 305,700 | 433,710 | 408,810 | 472,496 | 415,085 | |
| Recycling rate (%) | 98.4 | 98.7 | 97.6 | 97.9 | 97.6 | 98.1 | |
| Final waste treatment volume | 3,714.6 | 3,064.9 | 2,663.3 | 2,322.9 | 3,039.6 | 2,111.9 | |
| Industrial waste | Total waste discharge | 126,287 | 153,976 | 160,314 | 144,912 | 163,520 | 140,980 |
| Recycled resources (recycling) volume |
120,119 | 128,606 | 149,557 | 136,286 | 152,132 | 132,856 | |
| Recycling rate (%) | 95.1 | 83.5 | 93.3 | 94.0 | 93.0 | 94.2 | |
| Final waste treatment volume | 3,714.6 | 3,064.9 | 2,663.3 | 2,322.9 | 3,039.6 | 2,111.9 | |
Water
Water resource input volume
(m3)
| Aisin Corporation | ||||||
|---|---|---|---|---|---|---|
| Item | FY2021 | FY2022 | FY2023 | FY2024 | FY2025 | |
| Total input volume | 2,352,425 | 3,759,825 | 3,179,841 | 3,337,982 | 2,956,178 | |
| Breakdown by type | Public water supply | 458,510 | 863,809 | 634,353 | 597,423 | 587,941 |
| Industrial water | 1,802,141 | 2,350,054 | 1,944,084 | 1,938,072 | 1,786,936 | |
| Groundwater water | 91,774 | 545,962 | 601,404 | 802,487 | 581,301 | |
| Consolidated | ||||||
|---|---|---|---|---|---|---|
| Item | FY2021 | FY2022 | FY2023 | FY2024 | FY2025 | |
| Total input volume | 14,905,571 | 15,050,599 | 14,015,795 | 14,119,698 | 13,126,934 | |
| Breakdown by type | Public water supply | 3,802,892 | 3,770,163 | 3,460,834 | 3,405,758 | 3,168,517 |
| Industrial water | 8,263,611 | 8,610,289 | 7,937,978 | 8,009,387 | 7,457,756 | |
| Groundwater water | 2,839,068 | 2,670,147 | 2,616,984 | 2,704,552 | 2,500,661 | |
Total discharge volume
(m3)
| Aisin Corporation | |||||
|---|---|---|---|---|---|
| Item | FY2021 | FY2022 | FY2023 | FY2024 | FY2025 |
| Public water areas | 2,348,615 | 3,353,633 | 2,941,031 | 2,848,780 | 2,341,248 |
| 51 domestic Group companies (52 companies in FY2021, 50 companies in FY2022, 56 companies in FY2023, 52 companies in FY2024) |
|||||
|---|---|---|---|---|---|
| Item | FY2021 | FY2022 | FY2023 | FY2024 | FY2025 |
| Public water areas | 7,807,464 | 7,208,541 | 6,579,416 | 6,544,203 | 5,934,957 |
Transportation
CO2 emissions are calculated using the methods specified in the Enforcement Regulations of the Law Concerning the Rational Use of Energy and related guidelines.
CO2 emissions from transportation
(t-CO2)
| Aisin Corporation | |||||
|---|---|---|---|---|---|
| Item | FY2021 | FY2022 | FY2023 | FY2024 | FY2025 |
| Total emissions | 12,541 | 26,909 | 26,483 | 26,143 | 26,054 |
| 51 domestic Group companies (52 companies in FY2021, 50 companies in FY2022, 56 companies in FY2023, 52 companies in FY2024) |
|||||
|---|---|---|---|---|---|
| Item | FY2021 | FY2022 | FY2023 | FY2024 | FY2025 |
| Total emissions | 84,569 | 89,691 | 86,823 | 86,077 | 84,075 |
Emissions data by plant
“Water quality”
Units: pH (none), E. coli (cells/cc), dioxins (pg-TEQ/l), others (mg/l), { } (daily average), ― (not set), ND (below detection limit)
Regulatory limit: the strictest values specified in the environmental laws/regulations, ordinances and agreements
If measured only once, the value is listed in the “maximum” column.
For the following regulated items, values were below the limit of quantification (not detected) at all plants
Phenols, all chromes, all cyanides, hexavalent chromium, cadmium, lead, all mercuries, alkyl mercury, arsenic, organic phosphorus, PCB, trichloroethylene, tetrachloroethylene, dichloromethane, carbon tetrachloride, 1,2-dichloroethane, 1,1-dichloroethylene, cis-1,2-dichloroethylene, 1,1,1-trichloroethane, 1,1,2-trichloroethane, 1,3-dichloropropene, thiuram, simazine, thiobencarb, benzene, selenium
“Atmosphere”
Units: particulates (g/Nm3), NOx (ppm), SOx (k value), hydrogen chloride (mg/Nm3), dioxins (ng-TEQ/Nm3)
Regulatory limit: the strictest values specified in the environmental laws/regulations, ordinances and agreements
Measured value: the maximum value recorded (if multiple facilities exist, the value for the facility with the most stringent regulatory limit is presented)
“PRTR act handling volume and emission/transfer volume”
Unit: kg/year, except for dioxins (mg-TEQ/year)
Handling volume: excludes volumes below 1000kg/year (500 kg/year for specified Class 1 substances)
Kariya district
Water quality (prototype plant / technical development research institute)
| Assessed factor | Regulatory limit | Aisin standard | Measured value | ||
|---|---|---|---|---|---|
| Minimum | Average | Maximum | |||
| pH | 5.8~8.6 | 5.8~8.6 | 6.8 | 7.4 | 8 |
| COD | 25{20} | 20 | 1.7 | 2.6 | 4.1 |
| BOD | 25{20} | 20 | ND | 1.4 | 5.3 |
| SS | 30{20} | 20 | ND | 0.3 | 1 |
| Oil content | 5 | 2 | ND | 0.2 | 0.5 |
| E. coli | 3000 | 1000 | ND | 15 | 110 |
| Total nitrogen (N) | 120{60} | 15 | 3.2 | 6.3 | 8.1 |
| Total phosphorus (P) | 16{8} | 1 | ND | 0.02 | 0.04 |
| Iron (Fe) | 5 | 2 | ND | ND | ND |
| Manganese (Mn) | 10 | 2 | ND | ND | ND |
| Zinc (Zn) | 2 | 1 | ND | ND | ND |
| Copper (Cu) | 1 | 0.5 | ND | ND | ND |
| 1,4-dioxane | 0.5 | ND | ND | ND | ND |
| Fluorine (F) | 8 | 5 | ND | 0.1 | 0.1 |
| Boron (B) | 10 | 8 | ND | ND | ND |
Atmosphere (excluding facilities owned by ADVICS)
| Assessed factor | Facility | Regulatory limit | Aisin standard | Measured value |
|---|---|---|---|---|
| Particulates | Boiler | 0.2 | 0.1 | < 0.002 |
| Gas engine | 0.05 | 0.04 | < 0.005 | |
| Water heaters and coolers | 0.1 | 0.08 | < 0.003 | |
| SOx | Boiler | 1.75 | 1.4 | < 0.05 |
| Gas engine | 1.75 | 1.4 | < 0.2 | |
| Water heaters and coolers | 1.75 | 1.4 | < 0.008 | |
| NOx | Boiler | ― | 150 | 30 |
| Gas engine | 200 | 180 | 170 | |
| Water heaters and coolers | 150 | 120 | 29 |
Handa district (Handa Plant, Handa Electronics Plant)
Water quality
| Assessed factor | Regulatory limit | Aisin standard | Measured value | ||
|---|---|---|---|---|---|
| Minimum | Average | Maximum | |||
| pH | 5.0~9.0 | 6.0~8.0 | 6.7 | 7.2 | 8.0 |
| COD | 15 | 10 | 1.0 | 3.2 | 4.7 |
| BOD | 15 | 10 | 0.7 | 2.0 | 5.0 |
| SS | 15 | 10 | ND | 0.3 | 1.2 |
| Oil content | 2 | 2 | ND | 0.2 | 0.3 |
| E. coli | 3000 | 1000 | 7 | 117 | 560 |
| Total nitrogen (N) | 120{60} | 15 | 2.0 | 3.5 | 4.6 |
| Total phosphorus (P) | 16{8} | 2 | 0.01 | 0.05 | 0.12 |
| Iron (Fe) | 3 | 3 | ND | 0.1 | 0.2 |
| Manganese (Mn) | 3 | 3 | ND | ND | ND |
| Zinc (Zn) | 2 | 1 | ND | 0.04 | 0.07 |
| Copper (Cu) | 1 | 0.5 | ND | ND | ND |
| 1,4-dioxane | 0.5 | ND | ND | ND | ND |
| Fluorine (F) | 8 | 2 | ND | ND | ND |
| Boron (B) | 10 | 8 | ND | ND | ND |
Atmosphere
| Assessed factor | Facility | Regulatory limit | Aisin standard | Measured value |
|---|---|---|---|---|
| Particulates | Boiler | 0.1 | 0.08 | < 0.002 |
| Water heaters and coolers | 0.1 | 0.08 | < 0.003 | |
| SOx | Boiler | 1.75 | 1.5 | < 0.005 |
| Water heaters and coolers | 1.75 | 1.5 | < 0.2 | |
| NOx | Boiler | 150 | 120 | 39 |
| Water heaters and coolers | 150 | 120 | 23 |
PRTR act handling volume and discharge/transfer volume
| Chemical substance | Amount handled | Amount released | Amount transferred | ||
|---|---|---|---|---|---|
| To the atmosphere | To public waterways | To sewers | Elsewhere | ||
| Methylenebis (4,1-phenylene) = Diisocyanate |
2,000 | 0 | 0 | 0 | 0 |
Anjo Plant (Enokimae)
Water quality
| Assessed factor | Regulatory limit | Aisin standard | Measured value | ||
|---|---|---|---|---|---|
| Minimum | Average | Maximum | |||
| pH | ― | 5.8~8.6 | 6.9 | 7.7 | 8.1 |
| COD | 25{20} | 10 | ND | 3.5 | 5.4 |
| BOD | 25{20} | 10 | ND | 0.7 | 2 |
| SS | 30{20} | 10 | ND | 0.2 | 0.7 |
| Oil content | 2 | 1.6 | ND | 0.2 | 0.4 |
| E. coli | ― | 300 | ND | 3 | 10 |
| Total nitrogen (N) | 25 | 10 | 1.1 | 3.4 | 5.6 |
| Total phosphorus (P) | 2 | 1 | ND | 0.09 | 0.20 |
| Iron (Fe) | ― | 3 | ND | ND | ND |
| Manganese (Mn) | ― | 3 | ND | ND | ND |
| Zinc (Zn) | ― | 1 | 0.08 | 0.26 | 0.6 |
| Copper (Cu) | ― | 3 | ND | ND | ND |
| 1,4-dioxane | 0.5 | ND | ND | ND | ND |
| Fluorine (F) | 8 | 2 | ND | ND | ND |
| Boron (B) | 10 | 8 | ND | ND | ND |
PRTR act handling volume and discharge/transfer volume
| Chemical substance | Amount handled | Amount released | Amount transferred | ||
|---|---|---|---|---|---|
| To the atmosphere | To public waterways | To sewers | Elsewhere | ||
| Antimony and its compounds | 3,600 | 0 | 0 | 0 | 0 |
Shinkawa Plant
Water quality
| Assessed factor | Regulatory limit | Aisin standard | Measured value | ||
|---|---|---|---|---|---|
| Minimum | Average | Maximum | |||
| pH | ― | 5.8~8.6 | 6.9 | 7.5 | 8.0 |
| COD | ― | 20 | ND | 0.4 | 0.7 |
| BOD | ― | 20 | ND | 0.6 | 1.2 |
| SS | ― | 20 | ND | 0.2 | 1.3 |
| Oil content | ― | 3 | ND | 0.2 | 0.3 |
| E. coli | ― | 1000 | ND | 1 | 1 |
| Total nitrogen (N) | ― | 30 | 0.3 | 0.5 | 0.8 |
| Total phosphorus (P) | ― | 3 | ND | 0.01 | 0.01 |
| Iron (Fe) | ― | 2 | ND | ND | ND |
| Manganese (Mn) | ― | 2 | ND | ND | ND |
| Zinc (Zn) | ― | 1 | ND | 0.04 | 0.10 |
| Copper (Cu) | ― | 0.5 | ND | ND | ND |
| 1,4-dioxane | 0.5 | ND | ND | ND | ND |
| Fluorine (F) | 8 | 2 | ND | ND | ND |
| Boron (B) | 10 | 8 | ND | ND | ND |
Shintoyo Plant
Water quality
| Assessed factor | Regulatory limit | Aisin standard | Measured value | ||
|---|---|---|---|---|---|
| Minimum | Average | Maximum | |||
| pH | All wastewater is treated at the wastewater treatment facility at Aisin Takaoka and therefore excluded | ||||
| COD | |||||
| BOD | |||||
| SS | |||||
| Oil content | |||||
| E. coli | |||||
| Total nitrogen (N) | |||||
| Total phosphorus (P) | |||||
| Iron (Fe) | |||||
| Zinc (Zn) | |||||
| Copper (Cu) | |||||
| Fluorine (F) | |||||
| Boron (B) | |||||
Atmosphere
| Assessed factor | Facility | Regulatory limit | Aisin standard | Measured value |
|---|---|---|---|---|
| Particulates | Boiler | 0.1 | 0.08 | < 0.002 |
| Gas carburizing furnace | 0.2 | 0.16 | 0.0031 | |
| Drying furnace | 0.4 | 0.32 | < 0.002 | |
| SOx | Boiler | 9 | 7 | < 0.07 |
| Gas carburizing furnace | 9 | 7 | < 0.02 | |
| Drying furnace | 9 | 7 | < 0.2 | |
| NOx | Boiler | ― | 150 | 36 |
| Gas carburizing furnace | 200 | 160 | 10 | |
| Drying furnace | ― | 180 | < 3 |
PRTR act handling volume and discharge/transfer volume
| Chemical substance | Amount handled | Amount released | Amount transferred | ||
|---|---|---|---|---|---|
| To the atmosphere | To public waterways | To sewers | Elsewhere | ||
| Di-2-ethylhexyl adipate | 1,800 | 0 | 0 | 0 | 0 |
| Diethanolamine | 1,400 | 0 | 0 | 0 | 270 |
| Sulfide (2,4,4-trimethylpentene) | 15,000 | 0 | 0 | 0 | 15,000 |
Ogawa Plant
Water quality
| Assessed factor | Regulatory limit | Aisin standard | Measured value | ||
|---|---|---|---|---|---|
| Minimum | Average | Maximum | |||
| pH | 6.5~8.5 | 6.5~8.5 | 6.9 | 7.6 | 8 |
| COD | 25{20} | 10 | ND | 0.9 | 1.6 |
| BOD | 10 | 10 | ND | 0.6 | 1.3 |
| SS | 10 | 10 | ND | 0.2 | 0.6 |
| Oil content | 2 | 2 | ND | 0.2 | 0.2 |
| E. coli | 300 | 300 | ND | 16 | 75 |
| Total nitrogen (N) | 120{60} | 30 | 2.3 | 6.5 | 9.3 |
| Total phosphorus (P) | 16{8} | 3 | 0.07 | 0.31 | 0.51 |
| Iron (Fe) | 2 | 2 | ND | 0.1 | 0.2 |
| Manganese (Mn) | 2 | 2 | ND | ND | ND |
| Zinc (Zn) | 2 | 1 | ND | 0.05 | 0.10 |
| Copper (Cu) | 0.2 | 0.2 | ND | ND | ND |
| 1,4-dioxane | 0.5 | ND | ND | ND | ND |
| Fluorine (F) | 2 | 2 | ND | ND | ND |
| Boron (B) | 10 | 8 | ND | ND | ND |
Atmosphere
| Assessed factor | Facility | Regulatory limit | Aisin standard | Measured value |
|---|---|---|---|---|
| Particulates | Boiler | 0.1 | 0.08 | < 0.002 |
| Heating furnace | 0.2 | 0.16 | < 0.002 | |
| Adhesive oil treatment | 0.3 | 0.24 | 0.0023 | |
| SOx | Boiler | 3 | 2.4 | < 0.008 |
| Heating furnace | 3 | 2.4 | < 0.02 | |
| Adhesive oil treatment | 3 | 2.4 | < 0.02 | |
| NOx | Boiler | 150 | 120 | 30 |
| Heating furnace | 180 | 144 | 35 | |
| Adhesive oil treatment | ― | 160 | 15 |
PRTR act handling volume and discharge/transfer volume
| Chemical substance | Amount handled | Amount released | Amount transferred | ||
|---|---|---|---|---|---|
| To the atmosphere | To public waterways | To sewers | Elsewhere | ||
| Water-soluble zinc Compounds | 2,300 | 0 | 0.0 | 0 | 2,300 |
| Nickel compounds | 11,000 | 0 | 0.1 | 0 | 660 |
| Boron compounds | 4,100 | 0 | 0 | 0 | 4,100 |
| Diethanolamine | 1,200 | 0 | 0 | 0 | 0 |
| Cyclohexane | 1,100 | 1,100 | 0.0 | 0 | 0 |
| Heptane | 2,400 | 2,400 | 0 | 0 | 0 |
| Sulfide (2,4,4-trimethylpentene) | 3,500 | 0 | 0 | 0 | 0 |
Nishio district (Nishio Die Casting Plant, Nishio Engine Plant, machine tool plant)
Water quality
| Assessed factor | Regulatory limit | Aisin standard | Measured value | ||
|---|---|---|---|---|---|
| Minimum | Average | Maximum | |||
| pH | 5.8~8.6 | 5.8~8.6 | 6.6 | 7.0 | 7.6 |
| COD | 10 | 10 | 1.0 | 2.1 | 2.8 |
| BOD | 10 | 10 | ND | 0.9 | 2.6 |
| SS | 10 | 10 | ND | 0.2 | 0.9 |
| Oil content | 2{1} | 2 | ND | 0.2 | 0.5 |
| E. coli | 300 | 300 | ND | 10 | 35 |
| Total nitrogen (N) | 10 | 10 | 1.2 | 1.9 | 2.5 |
| Total phosphorus (P) | 1 | 1 | ND | 0.02 | 0.03 |
| Iron (Fe) | 3 | 3 | ND | 0.1 | 0.2 |
| Manganese (Mn) | 3 | 3 | ND | ND | ND |
| Zinc (Zn) | 1 | 1 | ND | 0.03 | 0.08 |
| Copper (Cu) | 0.5 | 0.5 | ND | ND | ND |
| 1,4-dioxane | 0.5 | ND | ND | ND | ND |
| Fluorine (F) | 5 | 2 | ND | 0.1 | 0.1 |
| Boron (B) | 10 | 8 | ND | ND | ND |
Atmosphere
| Assessed factor | Facility | Regulatory limit | Aisin standard | Measured value |
|---|---|---|---|---|
| Particulates | Boiler | ― | 0.1 | < 0.002 |
| Melting furnace | 0.2 | 0.16 | 0.078 | |
| Heating furnace | 0.2 | 0.16 | < 0.002 | |
| Waste incinerator | 0.05 | 0.04 | < 0.003 | |
| Melting furnace (ordinance) | 0.4 | 0.32 | 0.035 | |
| Heating furnace (ordinance) | 0.4 | 0.32 | < 0.002 | |
| SOx | Boiler | 3 | 3 | < 0.07 |
| Melting furnace | 3 | 3 | < 0.4 | |
| Heating furnace | 3 | 3 | < 0.02 | |
| Waste incinerator | 3 | 3 | 0.88 | |
| Melting furnace (ordinance) | 3 | 3 | < 0.05 | |
| Heating furnace (ordinance) | 3 | 3 | < 0.02 | |
| NOx | Boiler | ― | 150 | 48 |
| Melting furnace | 180 | 140 | 66 | |
| Heating furnace | 180 | 140 | 43 | |
| Waste incinerator | 150 | 120 | 74 | |
| Melting furnace (ordinance) | ― | 140 | 41 | |
| Heating furnace (ordinance) | ― | 140 | 25 | |
| HCl | Waste incinerator | 150 | 120 | 54 |
| Total mercury | Waste incinerator | 50 | 40 | 2.1 |
PRTR act handling volume and discharge/transfer volume
| Chemical substance | Amount handled | Amount released | Amount transferred | ||
|---|---|---|---|---|---|
| To the atmosphere | To public waterways | To sewers | Elsewhere | ||
| Nickel | 2,100 | 0 | 3.5 | 0 | 650 |
| Diethanolamine | 1,800 | 0 | 0 | 0 | 0 |
| Diethylene glycol monobutyl ether | 1,200 | 0 | 0 | 0 | 0 |
| Mercury | ― | 0.1 | 0 | 0 | 0 |
| Dioxin | ― | 140 | ― | ― | 0 |
Kinuura Plant
Water quality
| Assessed factor | Regulatory limit | Aisin standard | Measured value | ||
|---|---|---|---|---|---|
| Minimum | Average | Maximum | |||
| pH | 5.8~8.6 | 6.0~8.6 | 6.9 | 7.0 | 7.3 |
| COD | 40{30} | 10 | 1.3 | 2.5 | 3.5 |
| BOD | 20{15} | 10 | ND | 1.0 | 5.4 |
| SS | 25{20} | 10 | ND | 0.2 | 0.3 |
| Oil content | 10 | 5 | ND | ND | ND |
| E. coli | 3000 | 300 | ND | 1 | 1 |
| Total nitrogen (N) | 120{60} | 20 | 4.9 | 6.7 | 10 |
| Total phosphorus (P) | 16{8} | 1 | 0.03 | 0.10 | 0.16 |
| Iron (Fe) | All wastewater from Kimura Plant is treated at Aisin Sin'ei and therefore excluded | ||||
| Zinc (Zn) | |||||
| Copper (Cu) | |||||
| Fluorine (F) | |||||
| Boron (B) | |||||
Atmosphere
| Assessed factor | Facility | Regulatory limit | Aisin standard | Measured value |
|---|---|---|---|---|
| Particulates | Boiler | ― | 0.04 | < 0.003 |
| SOx | 1.17 | 0.9 | < 0.005 | |
| NOx | ― | 150 | 36 |
PRTR act handling volume and discharge/transfer volume
| Chemical substance | Amount handled | Amount released | Amount transferred | ||
|---|---|---|---|---|---|
| To the atmosphere | To public waterways | To sewers | Elsewhere | ||
| Indium | 5,900 | 0 | 0 | 0 | 0 |
| Ethylbenzene | 12,000 | 6,000 | 0 | 0 | 0 |
| Xylene | 12,000 | 6,500 | 0 | 0 | 0 |
| Toluene | 33,000 | 6,700 | 0 | 0 | 0 |
| Methylene bis (4,1-phenylene) diisocyanate |
1,000 | 0 | 0 | 0 | 0 |
| Trimethylbenzene | 9,900 | 9,900 | 0 | 0 | 0 |
| Methyl isobutyl ketone | 2,000 | 2,000 | 0 | 0 | 0 |
Anjo district (plant 1, plant 2, motor plant)
Water quality
| Assessed factor | Regulatory limit | Aisin standard | Measured value | ||
|---|---|---|---|---|---|
| Minimum | Average | Maximum | |||
| pH | 6.0~8.0 | 6.1~7.9 | 7.1 | 7.4 | 7.7 |
| COD | 10 | 9 | ND | 0.6 | 1.7 |
| BOD | 10 | 9 | ND | 3.3 | 5.0 |
| SS | 10 | 9 | ND | ND | ND |
| Oil content | 2 | 1.8 | ND | ND | ND |
| E. coli | 200 | 180 | ND | ND | ND |
| Total nitrogen (N) | 10 | 9 | 0.4 | 1.0 | 3.9 |
| Total phosphorus (P) | 1 | 0.9 | 0.10 | 0.19 | 0.45 |
| Iron (Fe) | 3 | 2.7 | ND | ND | ND |
| Manganese (Mn) | 3 | 2.7 | ND | ND | ND |
| Zinc (Zn) | 1 | 0.9 | 0.02 | 0.03 | 0.04 |
| Copper (Cu) | 0.5 | 0.45 | ND | ND | ND |
| 1,4-dioxane | 0.5 | 0.3 | ND | ND | ND |
| Fluorine (F) | 5 | 3 | ND | ND | ND |
| Boron (B) | 10 | 6 | ND | ND | ND |
Atmosphere
| Assessed factor | Facility | Regulatory limit | Aisin standard | Measured value |
|---|---|---|---|---|
| Particulates | Boiler | 0.3 | 0.24 | 0.003 |
| Water heaters and coolers | 0.1 | 0.08 | < 0.005 | |
| Heating furnace | 0.2 | 0.16 | < 0.002 | |
| SOx | Boiler | 15 | 3 | ― |
| Water heaters and coolers | 15 | 3 | ― | |
| Heating furnace | 15 | 3 | ― | |
| NOx | Boiler | ― | ― | ― |
| Water heaters and coolers | 150 | 96 | 36 | |
| Heating furnace | 180 | 115 | < 38 |
PRTR act handling volume and discharge/transfer volume
| Chemical substance | Amount handled | Amount released | Amount transferred | ||
|---|---|---|---|---|---|
| To the atmosphere | To public waterways | To sewers | Elsewhere | ||
| Ethylbenzene | 1,500 | 0.1 | 0 | 0 | 0 |
| Xylene | 6,100 | 0.3 | 0 | 0 | 0 |
| N,N-dicyclohexylamine | 3,700 | 0 | 0 | 0 | 3,700 |
| Toluene | 23,000 | 3.6 | 0 | 0 | 0 |
| Hexane | 1,600 | 1.8 | 0 | 0 | 0 |
| Benzene | 720 | 0.4 | 0 | 0 | 0 |
| Chlorinated straight-chain paraffins (limited to those with carbon numbers 14 to 17 and their mixtures) |
25,000 | 0 | 0 | 0 | 25,000 |
| Diethanolamine | 5,400 | 0 | 0 | 0 | 5,400 |
| Trimethylbenzene | 6,600 | 0.1 | 0 | 0 | 0 |
| Heptane | 4,500 | 4,200 | 0 | 0 | 0 |
| Sulfide (2,4,4-trimethylpentene) | 11,000 | 0 | 0 | 0 | 11,000 |
Okazaki district (Okazaki Plant, Okazaki electronics Plant)
Water quality
| Assessed factor | Regulatory limit | Aisin standard | Measured value | ||
|---|---|---|---|---|---|
| Minimum | Average | Maximum | |||
| pH | 5.8~8.6 | 5.9~8.5 | 7.5 | 7.8 | 8.0 |
| COD | 10 | 9 | ND | 0.3 | 1.3 |
| BOD | 10 | 9 | 1.9 | 3.5 | 5 |
| SS | 10 | 9 | ND | ND | ND |
| Oil content | 2 | 1.8 | ND | ND | ND |
| E. coli | 300 | 270 | ND | ND | ND |
| Total nitrogen (N) | 10 | 9 | 0.4 | 1.0 | 3.2 |
| Total phosphorus (P) | 1 | 0.9 | 0.13 | 0.30 | 0.41 |
| Iron (Fe) | 3 | 2.7 | ND | ND | ND |
| Manganese (Mn) | 3 | 2.7 | ND | ND | ND |
| Zinc (Zn) | 1 | 0.9 | 0.02 | 0.02 | 0.05 |
| Copper (Cu) | 0.5 | 0.45 | ND | ND | ND |
| 1,4-dioxane | 0.25 | 0.15 | ND | ND | ND |
| Fluorine (F) | 1 | 0.6 | ND | ND | ND |
| Boron (B) | 10 | 6 | ND | ND | ND |
Atmosphere
| Assessed factor | Facility | Regulatory limit | Aisin standard | Measured value |
|---|---|---|---|---|
| Particulates | Boiler | 0.1 | 0.08 | < 0.002 |
| Heating furnace | 0.1 | 0.08 | < 0.002 | |
| SOx | Boiler | 7.59 | 6.83 | ― |
| Heating furnace | 7.59 | 6.83 | < 0.04 | |
| NOx | Boiler | ― | ― | ― |
| Heating furnace | 130 | 117 | 110 |
PRTR act handling volume and discharge/transfer volume
| Chemical substance | Amount handled | Amount released | Amount transferred | ||
|---|---|---|---|---|---|
| To the atmosphere | To public waterways | To sewers | Elsewhere | ||
| N,N-dicyclohexylamine | 1,700 | 0 | 0 | 0 | 1,700 |
| Diethanolamine | 2,100 | 0 | 0 | 0 | 2,100 |
| Triisopropanolamine | 3,300 | 0 | 0 | 0 | 3,300 |
| Heptane | 13,000 | 13,000 | 0 | 0 | 0 |
| Sulfide (2,4,4-trimethylpentene) | 1,300 | 0 | 0 | 0 | 1,300 |
Okazaki East Plant
Water quality
| Assessed factor | Regulatory limit | Aisin standard | Measured value | ||
|---|---|---|---|---|---|
| Minimum | Average | Maximum | |||
| pH | 5.8~8.6 | 5.9~8.5 | 7.1 | 7.4 | 7.8 |
| COD | 10 | 9 | 1.9 | 3.6 | 4.9 |
| BOD | 10 | 9 | ND | 0.3 | 1.5 |
| SS | 10 | 9 | ND | ND | ND |
| Oil content | 2 | 1.8 | ND | ND | ND |
| E. coli | 300 | 270 | ND | ND | ND |
| Total nitrogen (N) | 10 | 9 | 0.6 | 1.3 | 2.2 |
| Total phosphorus (P) | 1 | 0.9 | ND | 0.03 | 0.16 |
| Iron (Fe) | 3 | 2.7 | ND | ND | ND |
| Manganese (Mn) | 3 | 2.7 | ND | ND | ND |
| Zinc (Zn) | 1 | 0.9 | 0.03 | 0.04 | 0.06 |
| Copper (Cu) | 0.5 | 0.45 | ND | ND | ND |
| 1,4-dioxane | 0.25 | 0.15 | ND | ND | ND |
| Fluorine (F) | 1 | 0.6 | ND | ND | ND |
| Boron (B) | 10 | 6 | ND | ND | ND |
Atmosphere
| Assessed factor | Facility | Regulatory limit | Aisin standard | Measured value |
|---|---|---|---|---|
| Particulates | Boiler | 0.1 | 0.08 | 0.002 |
| Heating furnace | 0.1 | 0.08 | < 0.002 | |
| SOx | Boiler | 7.59 | 6.1 | ― |
| Heating furnace | 7.59 | 6.1 | < 0.06 | |
| NOx | Boiler | ― | ― | ― |
| Heating furnace | 150 | 135 | 130 |
PRTR act handling volume and discharge/transfer volume
| Chemical substance | Amount handled | Amount released | Amount transferred | ||
|---|---|---|---|---|---|
| To the atmosphere | To public waterways | To sewers | Elsewhere | ||
| N,N-dicyclohexylamine | 2,100 | 0 | 0 | 0 | 2,100 |
| Styrene | 5,500 | 4,100 | 0 | 0 | 1,400 |
| Diethanolamine | 2,500 | 0 | 0 | 0 | 2,500 |
| Heptane | 17,000 | 17,000 | 0 | 0 | 0 |
| Sulfide (2,4,4-trimethylpentene) | 1,600 | 0 | 0 | 0 | 1,600 |
Gamagori Plant
Water quality
| Assessed factor | Regulatory limit | Aisin standard | Measured value | ||
|---|---|---|---|---|---|
| Minimum | Average | Maximum | |||
| pH | 5.0~9.0 | 5.2~8.8 | 6.8 | 7.2 | 7.9 |
| COD | ― | ― | 0.6 | 2.0 | 8.6 |
| BOD | 25{20} | 22.5{18} | ND | 0.7 | 3.9 |
| SS | 30{20} | 27{18} | ND | ND | ND |
| Oil content | 2 | 1.8 | ND | ND | ND |
| E. coli | 3000 | 2700 | ND | 0.88 | 44 |
| Total nitrogen (N) | 120{60} | 108{54} | 1 | 3.1 | 7.4 |
| Total phosphorus (P) | 16{8} | 14.4{7.2} | ND | 0.02 | 0.07 |
| Iron (Fe) | 10 | 9 | ND | ND | ND |
| Manganese (Mn) | 10 | 9 | ND | ND | ND |
| Zinc (Zn) | 2 | 1.8 | 0.02 | 0.06 | 0.08 |
| Copper (Cu) | 1 | 0.9 | ND | ND | ND |
| 1,4-dioxane | 0.5 | 0.3 | ND | ND | ND |
| Fluorine (F) | 15 | 9 | ND | ND | ND |
| Boron (B) | 230 | 138 | ND | ND | ND |
Atmosphere
| Assessed factor | Facility | Regulatory limit | Aisin standard | Measured value |
|---|---|---|---|---|
| Particulates | Boiler | 0.3 | 0.24 | < 0.002 |
| Water heaters and coolers | 0.3 | 0.24 | 0.003 | |
| SOx | Boiler | 7.59 | 6.83 | ― |
| Water heaters and coolers | 7.59 | 6.83 | ― | |
| NOx | Boiler | ― | ― | ― |
| Water heaters and coolers | 144 | 130 | 69 |
PRTR act handling volume and discharge/transfer volume
| Chemical substance | Amount handled | Amount released | Amount transferred | ||
|---|---|---|---|---|---|
| To the atmosphere | To public waterways | To sewers | Elsewhere | ||
| Methylnaphthalene | 3,700 | 0 | 0 | 0 | 0 |
| Triisopropanolamine | 1,100 | 0 | 0 | 0 | 1,100 |
Kira Plant
Water quality
| Assessed factor | Regulatory limit | Aisin standard | Measured value | ||
|---|---|---|---|---|---|
| Minimum | Average | Maximum | |||
| pH | 5.8~8.6 | 5.9~8.5 | 7.2 | 7.5 | 7.9 |
| COD | 10 | 9 | ND | 1.3 | 3.5 |
| BOD | 10 | 9 | ND | 0.3 | 1.7 |
| SS | 10 | 9 | ND | ND | ND |
| Oil content | 2 | 1.8 | ND | ND | ND |
| E. coli | 300 | 270 | ND | ND | ND |
| Total nitrogen (N) | 10 | 9 | 1.3 | 2.3 | 3.3 |
| Total phosphorus (P) | 1 | 0.9 | 0.01 | 0.04 | 0.16 |
| Iron (Fe) | 3 | 2.7 | ND | ND | ND |
| Manganese (Mn) | 3 | 2.7 | ND | ND | ND |
| Zinc (Zn) | 1 | 0.9 | 0.04 | 0.05 | 0.06 |
| Copper (Cu) | 0.5 | 0.45 | ND | ND | ND |
| 1,4-dioxane | 0.5 | 0.3 | ND | ND | ND |
| Fluorine (F) | 5 | 3 | ND | ND | ND |
| Boron (B) | 10 | 6 | ND | ND | ND |
Atmosphere
| Assessed factor | Facility | Regulatory limit | Aisin standard | Measured value |
|---|---|---|---|---|
| Particulates | Boiler | ― | ― | 0.0084 |
| SOx | 3 | 2.4 | 0.061 | |
| NOx | ― | ― | 55 |
PRTR act handling volume and discharge/transfer volume
| Chemical substance | Amount handled | Amount released | Amount transferred | ||
|---|---|---|---|---|---|
| To the atmosphere | To public waterways | To sewers | Elsewhere | ||
| Triisopropanolamine | 3,600 | 0 | 0 | 0 | 3,600 |
| Heptane | 1,400 | 1,400 | 0 | 0 | 0 |
Shiroyama Plant
Water quality
| Assessed factor | Regulatory limit | Aisin standard | Measured value | ||
|---|---|---|---|---|---|
| Minimum | Average | Maximum | |||
| pH | 5.8~8.6 | 5.9~8.5 | 6.6 | 6.8 | 7.2 |
| COD | 10 | 9 | 1.0 | 2.2 | 4.0 |
| BOD | 10 | 9 | ND | 1.0 | 4.0 |
| SS | 10 | 9 | ND | ND | ND |
| Oil content | 2 | 1.8 | ND | ND | ND |
| E. coli | 300 | 270 | ND | 0.4 | 2.3 |
| Total nitrogen (N) | 10 | 9 | ND | 1.6 | 2.5 |
| Total phosphorus (P) | 1 | 0.9 | ND | 0.02 | 0.05 |
| Iron (Fe) | 3 | 2.7 | ND | ND | ND |
| Manganese (Mn) | 3 | 2.7 | 0.1 | 0.3 | 0.5 |
| Zinc (Zn) | 1 | 0.9 | ND | 0.02 | 0.08 |
| Copper (Cu) | 0.5 | 0.45 | ND | ND | ND |
| 1,4-dioxane | 0.5 | 0.3 | ND | ND | ND |
| Fluorine (F) | 5 | 3 | ND | ND | ND |
| Boron (B) | 10 | 6 | 1.6 | 2.2 | 2.7 |
Atmosphere
| Assessed factor | Facility | Regulatory limit | Aisin standard | Measured value |
|---|---|---|---|---|
| Particulates | Boiler | ― | ― | 0.0061 |
| Heating furnace | 0.2 | 0.15 | < 0.002 | |
| SOx | Boiler | 3 | 2.4 | 0.13 |
| Heating furnace | 3 | 2.4 | < 0.03 | |
| NOx | Boiler | ― | ― | 110 |
| Heating furnace | 180 | 145 | 60 |
PRTR act handling volume and discharge/transfer volume
| Chemical substance | Amount handled | Amount released | Amount transferred | ||
|---|---|---|---|---|---|
| To the atmosphere | To public waterways | To sewers | Elsewhere | ||
| Methylnaphthalene | 3,700 | 0 | 0 | 0 | 0 |
| Diethanolamine | 1,300 | 0 | 0 | 0 | 1,300 |
| Heptane | 1,500 | 1,500 | 0 | 0 | 0 |
Tahara Plant
Water quality
| Assessed factor | Regulatory limit | Aisin standard | Measured value | ||
|---|---|---|---|---|---|
| Minimum | Average | Maximum | |||
| pH | 6.0~8.5 | 6.1~8.4 | 6.7 | 7.2 | 7.5 |
| COD | 20{15} | 18{13.5} | 1.9 | 4.1 | 5.8 |
| BOD | 20 | 18 | ND | 0.08 | 1.5 |
| SS | 20{15} | 18{13.5} | ND | 0.02 | 1 |
| Oil content | 1 | 0.9 | ND | ND | ND |
| E. coli | 1500 | 1350 | ND | 4.5 | 220 |
| Total nitrogen (N) | 120{60} | 108{54} | 0.7 | 1.4 | 2.3 |
| Total phosphorus (P) | 16{8} | 14.4{7.2} | 0.03 | 0.12 | 0.38 |
| Iron (Fe) | 5 | 4.5 | ND | ND | ND |
| Manganese (Mn) | 5 | 4.5 | ND | 0.08 | 1 |
| Zinc (Zn) | 1 | 0.9 | 0.04 | 0.07 | 0.11 |
| Copper (Cu) | 0.5 | 0.45 | ND | ND | 0.03 |
| 1,4-dioxane | 0.5 | 0.3 | ND | 0.001 | 0.001 |
| Fluorine (F) | 7 | 4.2 | ND | ND | ND |
| Boron (B) | 230 | 138 | 0.2 | 0.6 | 1.2 |
Atmosphere
| Assessed factor | Facility | Regulatory limit | Aisin standard | Measured value |
|---|---|---|---|---|
| Particulates | Boiler | 0.2 | 0.16 | < 0.001 |
| Water heaters and coolers | 0.2 | 0.16 | < 0.001 | |
| Melting furnace | 0.2 | 0.16 | 0.018 | |
| Heating furnace | 0.1 | 0.08 | < 0.002 | |
| SOx | Boiler | 8.76 | 7.00 | < 0.01 |
| Water heaters and coolers | 8.76 | 7.00 | 0.13 | |
| Melting furnace | 8.76 | 7.00 | < 0.03 | |
| Heating furnace | 8.76 | 7.00 | < 0.6 | |
| NOx | Boiler | 160 | 128 | 35 |
| Water heaters and coolers | 160 | 128 | 86 | |
| Melting furnace | 160 | 115 | 55 | |
| Heating furnace | 104 | 83.2 | 11 |
PRTR act handling volume and discharge/transfer volume
| Chemical substance | Amount handled | Amount released | Amount transferred | ||
|---|---|---|---|---|---|
| To the atmosphere | To public waterways | To sewers | Elsewhere | ||
| N,N-dicyclohexylamine | 3,200 | 0 | 0 | 0 | 3,200 |
| Styrene | 14,000 | 14,000 | 0 | 0 | 0 |
| Chlorinated straight-chain paraffins | 12,000 | 0 | 0 | 0 | 12,000 |
| Heptane | 11,000 | 11,000 | 0 | 0 | 0 |
| Dioxins | ― | 1.8 | 0 | 0 | 0 |
7th AISIN Consolidated Environmental Action Plan (5-Year Projected Results)
We have formulated a 7th edition of our AISIN Consolidated Environmental Action Plan, a five-year environmental action guideline and plan covering FY2022 through FY2026 that aims to build a sustainable environment for the future and ensure a society in harmony with nature where everyone can live with peace of mind. By taking on these goals and initiatives and steadily working toward achieving them, we are connecting our environment with a sustainable future.
Building a decarbonized society
2050 vision
Aiming for carbon neutrality
| Broad initiatives | Implementation items & goals | Results (Projected as of Jan 2026) |
Score | ||||||||||
|---|---|---|---|---|---|---|---|---|---|---|---|---|---|
| ①Life cycle CO2 reduction |
|
Established priority categories and promoted roadmap creation and item prioritization/reduction activities within each working group Achieved SBTi certification for greenhouse gas emission targets (FY2024) | ◯ | ||||||||||
| ②Reducing CO2 emissions through product design |
|
Established lifecycle assessment (LCA) rules in the design phase and rolled out to group companies Implementing GHG reduction activities through efficiency improvements and reducing weight for 33 products under development in such areas as powertrains, body, and energy system products for clean energy vehicles | ◯ | ||||||||||
| ③Reduction of CO2 emissions from manufacturing |
|
Promoted energy conservation globally
Implemented CN promotion activities at production bases and group companies [Consolidated result] Reduction: 28% (projected for FY2026) |
◯ | ||||||||||
| ④Introduction of renewable energy to the manufacturing process |
|
Developed and followed roadmaps tailored to regional characteristics [Consolidated result] Adoption: 29% (projected for FY2026) |
◯ | ||||||||||
| ⑤CO2 emission reduction in logistics |
|
Improve loading rates and enhance transport efficiency through intra-group transportation [Domestic result] Reduction: 11.8% (projected for FY2026) |
◯ |
Building a recycling-oriented society
2050 vision
Minimizing environmental impact by maximizing resource efficiency
| Broad initiatives | Implementation items & goals | Results (Projected as of Jan 2026) |
Score | ||||||||||||||
|---|---|---|---|---|---|---|---|---|---|---|---|---|---|---|---|---|---|
|
⑥Raising resource efficiency Product design, product & technology development |
|
Reducing the use of materials through product lightweighting and miniaturization Promoting recycling via use of volume reduction equipment Implementing waste oil reuse and resin waste recycling in collaboration with suppliers Using recyclable dummy products Established technologies for removing foreign object from waste materials | ◯ | ||||||||||||||
| ⑦Reducing resource inputs and waste discharge in production |
|
Reducing emissions by fully utilizing resources within the group
Add value through material separation and recycling
Horizontal expansion of CE-reduction examples [Domestic result] Reduction: 35% (projected for FY2026) [Overseas result] Reduction: 57% (projected for FY2026) |
◯ | ||||||||||||||
| ⑧Contributing to building a resource circulation system for society as a whole |
|
Introduce consolidated shipping across six sites at three companies in the Mikawa region, maximizing loading efficiency through consolidated shipping Promoted reduction in packaging material usage by implementing returnable pallets for finished automatic transmission products destined overseas and improving packaging configurations | ◯ | ||||||||||||||
| ⑨Improving water resource efficiency in production |
|
Completed global rollout of measurement guidelines and reduction case studies to 140 group companies [Consolidated result] Reduction rate: 18% (projected for FY2026) [Result in High-risk sites] Achieved 12.5% reduction by addressing leak points, optimizing dilution, and operating intermittently. However, due to the relocation, the site previously classified as high risk was reclassified and excluded from the high-risk category. |
◯ | ||||||||||||||
| ⑩Contributions to regional water resource conservation, etc. |
|
Continue implementation of hydrobiological surveys of the Nishio-Chosen River and the Okazaki Higashi Aoki River Continue implementation of eight annual cleanup activities in areas surrounding factories Six instances of exceeding legal regulations and agreed-upon values | ✕ | ||||||||||||||
| ⑪Improving water resource environments through collaboration with suppliers |
|
Conducted hydrological risk surveys for suppliers (partner companies) Held study sessions to enhance understanding of the impact of hydrological risk on each company | ◯ |
Building a nature-harmonized society
2050 vision
Aiming for harmony with nature and local ecosystems worldwide
| Broad initiatives | Implementation items & goals | Results (Projected as of Jan 2026) |
Score | ||||||||||
|---|---|---|---|---|---|---|---|---|---|---|---|---|---|
| ⑫Reducing harm to biodiversity |
|
Conducted TNFD-based natural symbiosis evaluation analyses, and disclosure commencing from FY2024 Re-examining AISIN's approach to natural symbiosis and considering guideline revisions | △ | ||||||||||
| ⑬Biodiversity conservation at company locations |
|
Eight sites certified as “Nature-harmonized Factories” based on the AISIN Group's definition Two sites certified as “Sustainably Managed Natural Sites” by the Ministry of the Environment (areas where biodiversity conservation is being promoted). | ◯ | ||||||||||
| ⑭Contributing to the conservation and enhancement of local biodiversity |
|
Implemented a total of 18 projects globally | ◯ |
Foundational, cross-thematic activities
2050 vision
Aiming to advance the environmental management system
| Broad initiatives | Implementation items & goals | Results (Projected as of Jan 2026) |
Score |
|---|---|---|---|
| ⑮Reducing environmental impact substances in production activities |
|
Completed implementation of new system for compliance purposes Continued to reduce waste and evaluate alternative materials and products. The transition process is ongoing. | ◯ |
| ⑯Managing environmental affairs at the global Group level while strengthening our foundation for environmental action |
|
Initiating transition to unified certification across domestic group companies and affiliates to enhance EMS levels Promoting adoption and improvement through AISIN Global Environmental Standards (AGES) training Raising environmental awareness using “Seven (Environment cardinal rules) to protect the earth”. | ◯ |
| ⑰Supply chain management |
|
Revised Green Procurement Guidelines Completed establishment of information gathering system Conducted supplier environmental inspections | ◯ |
| ⑱Environmental communication and stakeholder engagement |
|
Conducted a total of 25 biodiversity conservation activities across five domestic locations (Hokkaido, Tohoku, Hokuriku, Mikawa, Kyushu). | ◯ |
7th AISIN Consolidated Environmental Action Plan (FY2025 Results)
| Broad initiatives | FY2025 target | FY2025 results | Evaluation |
|---|---|---|---|
| Building a decarbonized society | |||
| ①Life cycle CO2 reduction |
|
|
◯ |
| ②Reducing CO2 emissions through product design |
|
|
◯ |
| ③Introduction of renewable energy in manufacturing |
|
― | |
| ④Introduction of renewable energy in manufacturing |
|
― | |
| ⑤CO2 emission reduction in logistics |
|
|
◯ |
| Building a circular economy | |||
| ⑦Reducing resource inputs and industrial waste discharge |
|
|
◯ |
|
|
◯ | |
| ⑨Improving water resource efficiency in production |
|
|
✕ |
| ⑩Contributing to regional water resource conservation |
|
|
◯ |
| Building a nature-positive society | |||
| ⑫Reducing impacts on biodiversity |
|
|
◯ |
| ⑬Conserving biodiversity at Company locations |
|
|
◯ |
| ⑭Contributing to the conservation and enhancement of regional biodiversity |
|
|
◯ |
| Foundational action common to all themes | |||
| ⑮Reduction of environmentally impactful substances in manufacturing |
|
|
◯ |
| ⑯Operation of global Group environmental management and foundational strengthening of environmental initiative |
|
|
✕ |
| ⑰Supply chain management |
|
|
◯ |
| ⑱Environmental communication and stakeholder engagement |
|
|
◯ |
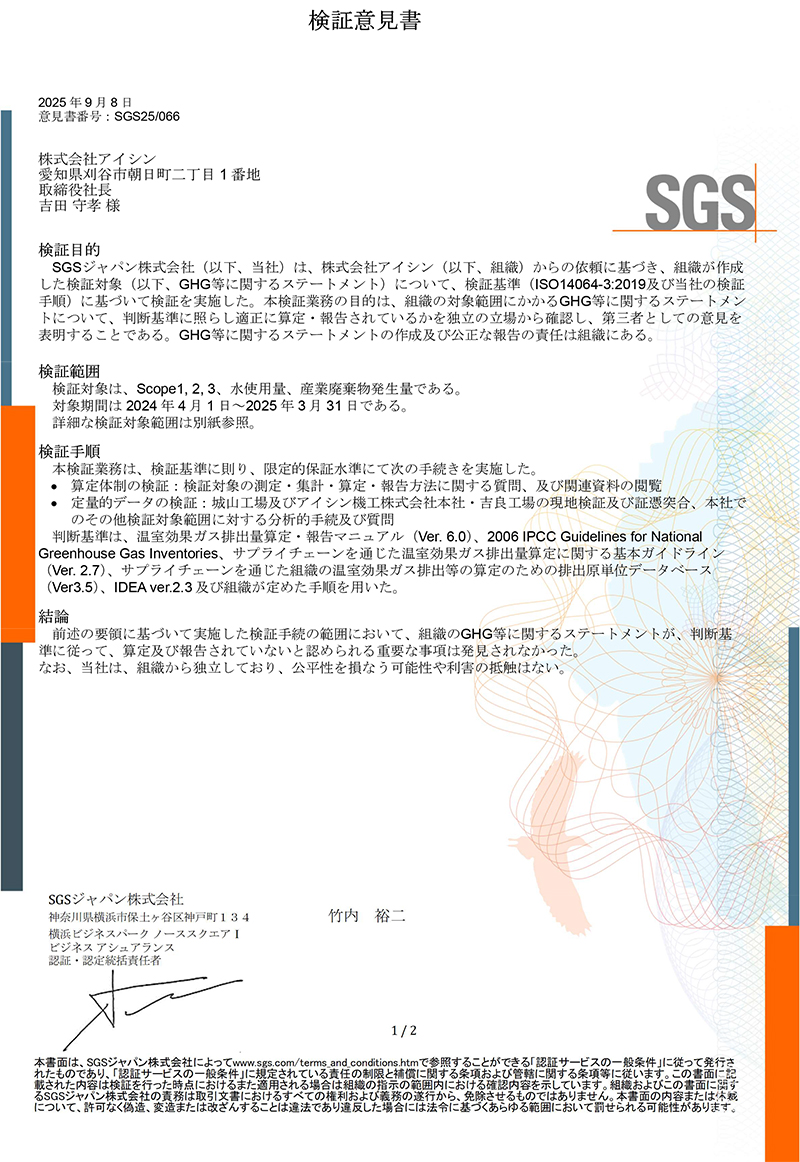
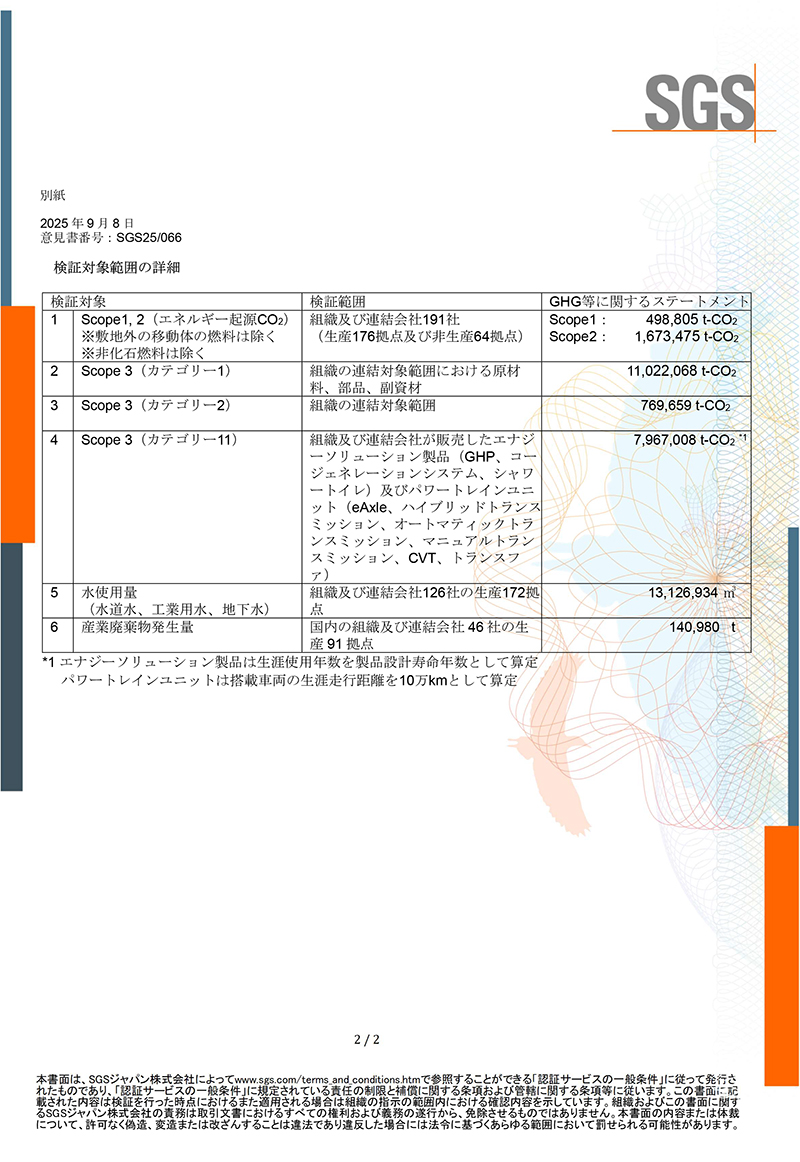
Third Party Verification