Financial Data (Consolidated)
(¥ million)
| FY2016 | FY2017 | FY2018 | FY2019 | FY2020 | FY2021 | FY2022 | FY2023 | FY2024 | FY2025 | |
|---|---|---|---|---|---|---|---|---|---|---|
| Financial position and operating results | ||||||||||
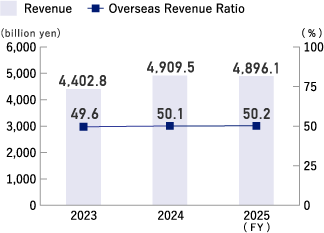
| Revenue | 3,245,985 | 3,562,622 | 3,908,937 | 4,043,110 | 3,784,585 | 3,525,799 | 3,917,434 | 4,402,823 | 4,909,557 | 4,896,104 |
| Ratio of revenue from overseas locations (%) | 43.7 | 41.8 | 41.1 | 41.2 | 42.1 | 42.3 | 44.6 | 49.6 | 50.1 | 50.2 |
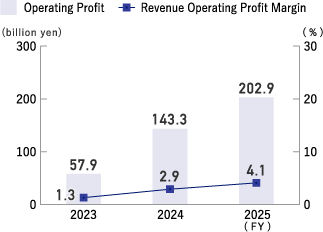
| Operating profit | 192,722 | 228,691 | 253,808 | 205,562 | 56,129 | 145,332 | 182,011 | 57,942 | 143,396 | 202,941 |
| Profit before income taxes | 194,060 | 237,311 | 268,171 | 217,486 | 53,395 | 167,523 | 219,983 | 73,741 | 149,877 | 173,440 |
| Profit attributable to the owners of the parent for the period | 100,332 | 126,653 | 134,551 | 110,123 | 24,061 | 105,638 | 141,941 | 37,670 | 90,813 | 107,586 |
| Equity attributable to owners of the parent company | 1,168,953 | 1,236,385 | 1,310,176 | 1,346,902 | 1,280,165 | 1,535,512 | 1,756,516 | 1,751,326 | 2,135,837 | 1,977,263 |
| Total assets | 3,009,377 | 3,338,339 | 3,527,910 | 3,751,880 | 3,992,652 | 4,027,103 | 4,205,801 | 4,135,826 | 4,643,016 | 4,284,600 |
| Capital expenditure | 294,188 | 237,449 | 260,315 | 389,932 | 290,646 | 190,268 | 218,771 | 221,494 | 230,033 | 223,738 |
| Depreciation | 186,197 | 197,168 | 213,430 | 226,418 | 242,167 | 240,016 | 245,257 | 263,562 | 259,831 | 257,434 |
| R&D expenses | 162,635 | 167,719 | 182,900 | 202,190 | 205,823 | 189,850 | 194,162 | 218,631 | 225,594 | 236,844 |
| R&D to revenue ratio (%) | 5.0 | 4.7 | 4.7 | 5.0 | 5.4 | 5.4 | 5.0 | 5.0 | 4.6 | 4.8 |
| Per-share information (¥) | ||||||||||
| EPS (basic earnings per share) *1 | 118.18 | 148.15 | 163.41 | 136.21 | 29.76 | 130.65 | 175.55 | 46.59 | 112.31 | 137.81 |
| BPS (book value of equity attributable to owners of the parent per share) *1 | 1,375.77 | 1,475.37 | 1,620.56 | 1,666.00 | 1,583.36 | 1,899.10 | 2,172.45 | 2,165.95 | 2,641.39 | 2,609.69 |
| Dividends*1 | 33.33 | 41.67 | 50.00 | 50.00 | 40.00 | 40.00 | 56.67 | 56.67 | 56.67 | 60.00 |
| Dividend payout ratio (%) | 28.2 | 28.1 | 30.6 | 36.7 | 134.4 | 30.6 | 32.3 | 121.6 | 50.5 | 43.5 |
| Cash flow | ||||||||||
| Net cash provided by (used in) operating activities | 294,184 | 394,812 | 311,542 | 354,942 | 327,552 | 343,314 | 193,343 | 237,970 | 499,740 | 339,870 |
| Net cash provided by (used in) investing activities | -228,437 | -229,109 | -229,346 | -414,494 | -273,876 | -138,175 | -204,952 | -186,857 | -93,153 | -146,948 |
| Net cash provided by (used in) financing activities | -88,162 | -31,617 | -73,634 | 13,164 | 275,382 | -373,880 | -135,859 | -127,752 | -211,699 | -270,221 |
| Free cash flow | 65,747 | 165,703 | 82,196 | -59,552 | 53,676 | 205,139 | -11,609 | 51,112 | 406,587 | 192,922 |
| Cash and cash equivalents | 263,217 | 394,559 | 406,508 | 357,195 | 675,162 | 520,028 | 386,906 | 317,693 | 527,191 | 451,690 |
| Financial Ratios | ||||||||||
| Operating profit ratio (%) | 5.9 | 6.4 | 6.5 | 5.1 | 1.5 | 4.1 | 4.6 | 1.3 | 2.9 | 4.1 |
| Ratio of equity attributable to owners of the parent (%) | 38.8 | 37.0 | 37.1 | 35.9 | 32.1 | 38.1 | 41.8 | 42.3 | 46.0 | 46.1 |
| ROE (ratio of profit to equity attributable to owners of the parent; %) | 8.4 | 10.5 | 10.6 | 8.3 | 1.8 | 7.5 | 8.6 | 2.1 | 4.7 | 5.2 |
| ROIC (return on invested capital; %)*2 | 9.8 | 11.5 | 11.6 | 8.6 | 1.7 | 5.1 | 6.6 | 1.8 | 5.3 | 7.1 |
- *1 A 3-for-1 stock split was implemented on October 1, 2024. Figures are adjusted to reflect the post-split ratio.
- *2 ROIC (return on invested capital): operating profit after income tax ÷ (inventories + property, plant, and equipment + intangible fixed assets)
Revenue/Overseas Revenue Ratio
Operating Profit/Revenue Operating Profit Margin
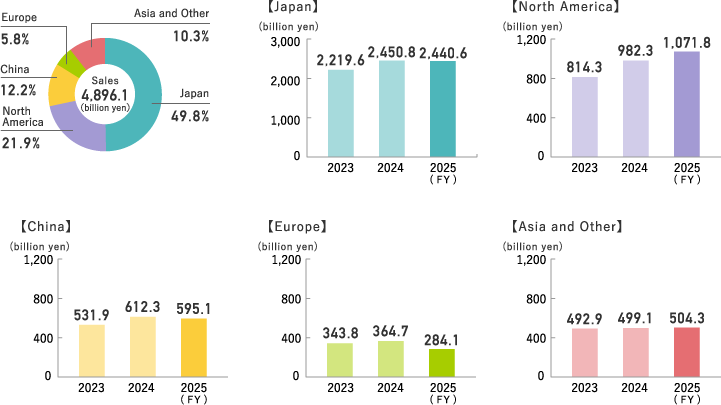
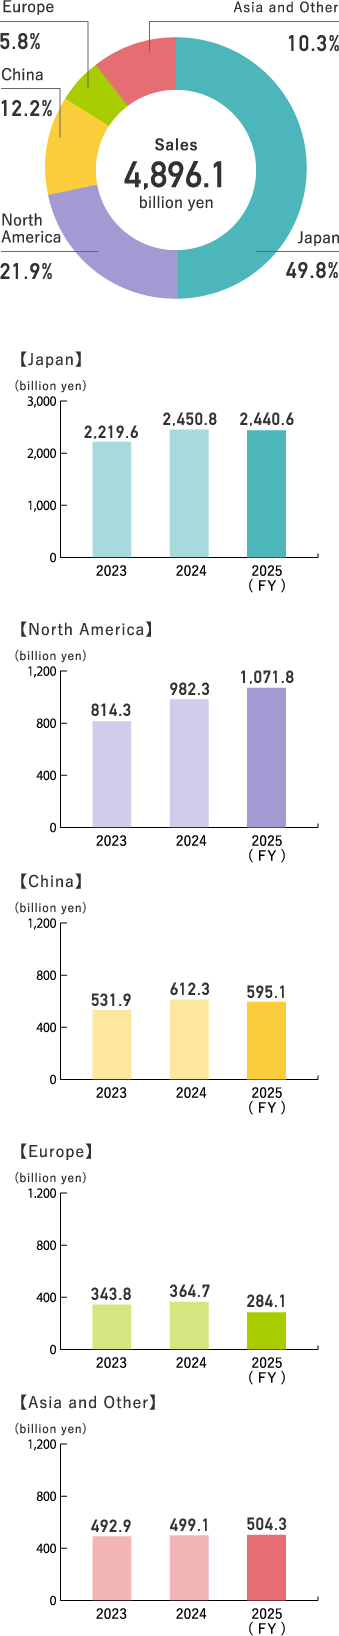
Sales by Region
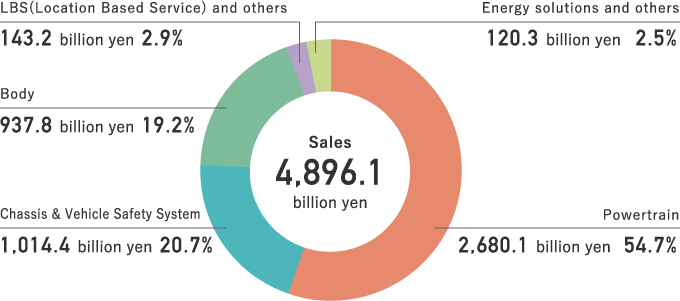
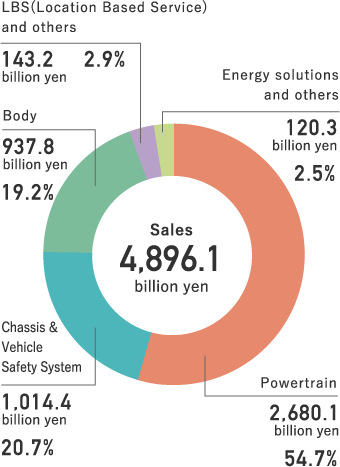
Revenue Breakdown by Product (FY2025)